With the global pandemic and digital shift in online education, a great number of people are looking towards online courses and online education. However, international offerings create a language barrier and high-cost courses. Tutosh more likely is a marketplace which not only for students but also provides great opportunities for teachers
There is no online learning platform with a clear learning path and same time less costly for students.
Discover - Define - Ideate and prototyping - Collect feedback - testing again - Hi-fi
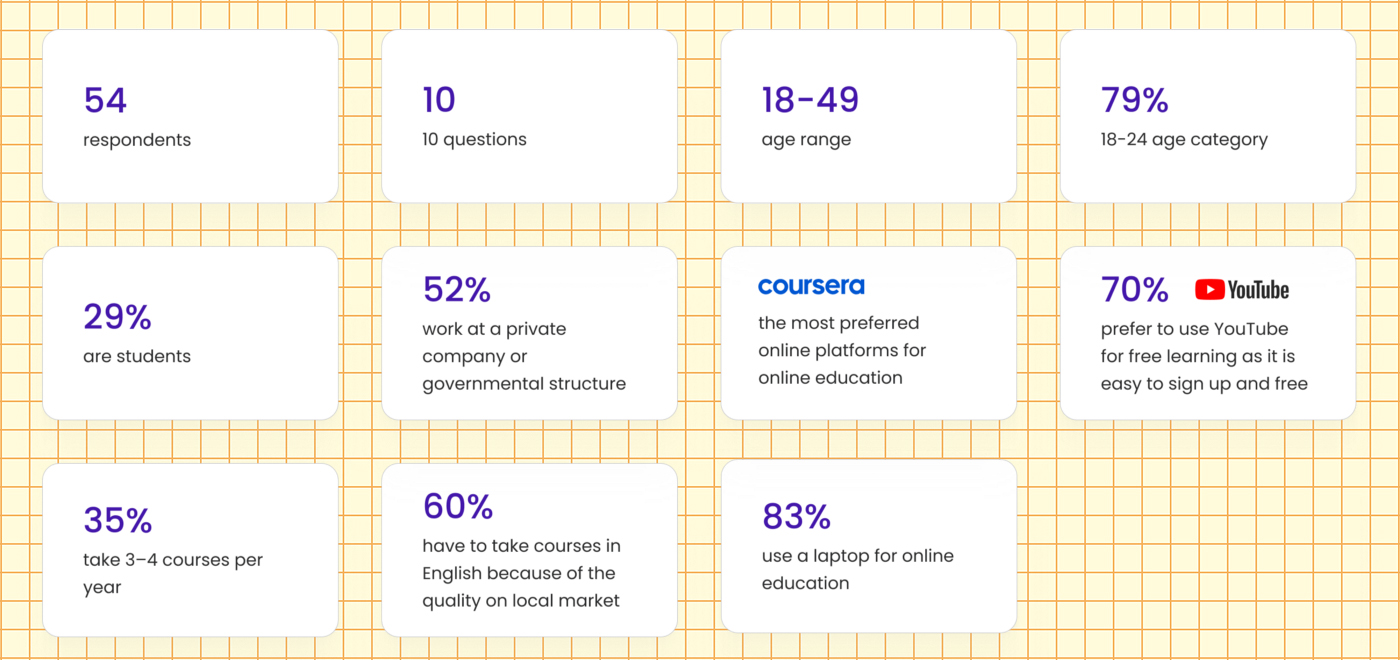
During our first meeting with the client, we took the opportunity to learn where the idea had come from and dissect the project brief. We discussed other similar services on the market and ran a Lean Canvas activity. Later I conducted a survey to gather quantitative data on user demographics and prioritise information based on value and relevance. This survey also included open ended questions to get more qualitative data on user pain points with current solutions.

COVID-19 created a massive surge in the number of people taking online courses in 2020
This showed us that the time is now and losing any time during 2020–2021 might be critical for the business. At this stage it was clear that we should enter the market with a MVP before it gets too saturated.
Mobile learning (m-learning) is one of the fastest-growing markets in e-learning, with an annual growth of 23%.Source: Report Linker
On average, employees onlyhave 24 minutes per week tospend on learning. E-learningtakes 40% to 60% lessemployee time than traditionallearning.Source: Josh Bersin and Brandon Hall
56% of employees would spend more time learning if their managers offered them courses.
Source: Linkedin
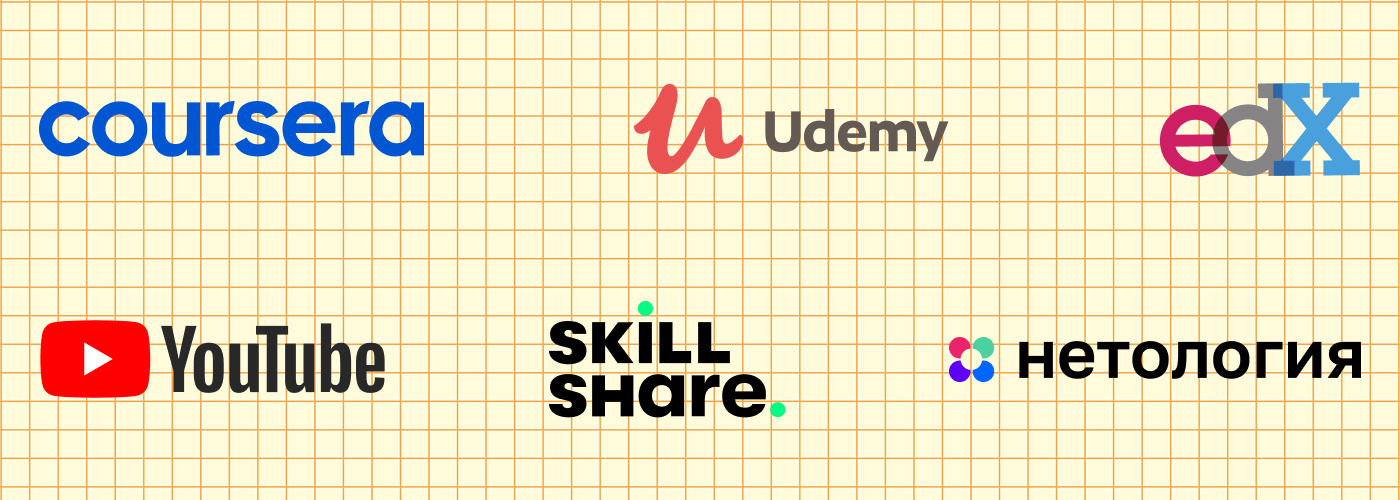
I began exploring competitors to familiarize myself with their offerings. I evaluated several features that were considered essential from user surveys and identified which ones tutosh could capitalize on to gain an advantage over other platforms.


Based on the survey and research, I identified causes for frustration. Then I used affinity mapping to group the pain points into similar categories on a whiteboard.

Maryam represents the majority of the target audience, whose pain points are related to the language barrier and cost-effective courses, lack of motivation, and pricing.

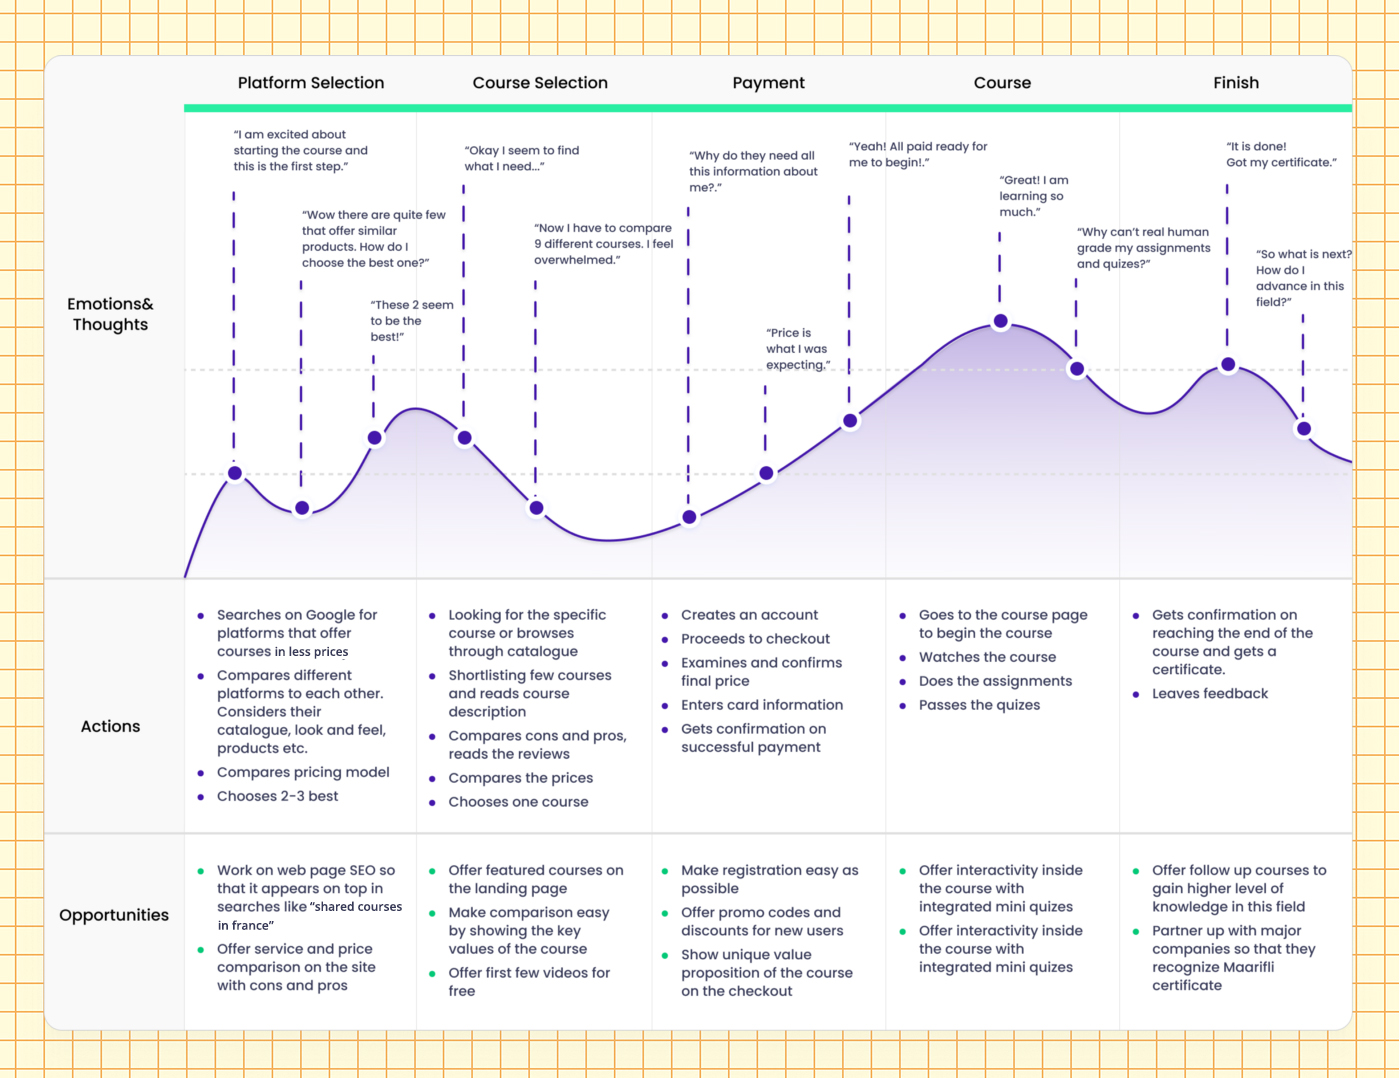
The user journey illustrates a typical trip of taking a new course for maryam. I created the map to empathize with maryam and to thoroughly showcase her emotions, thoughts and actions during this journey.

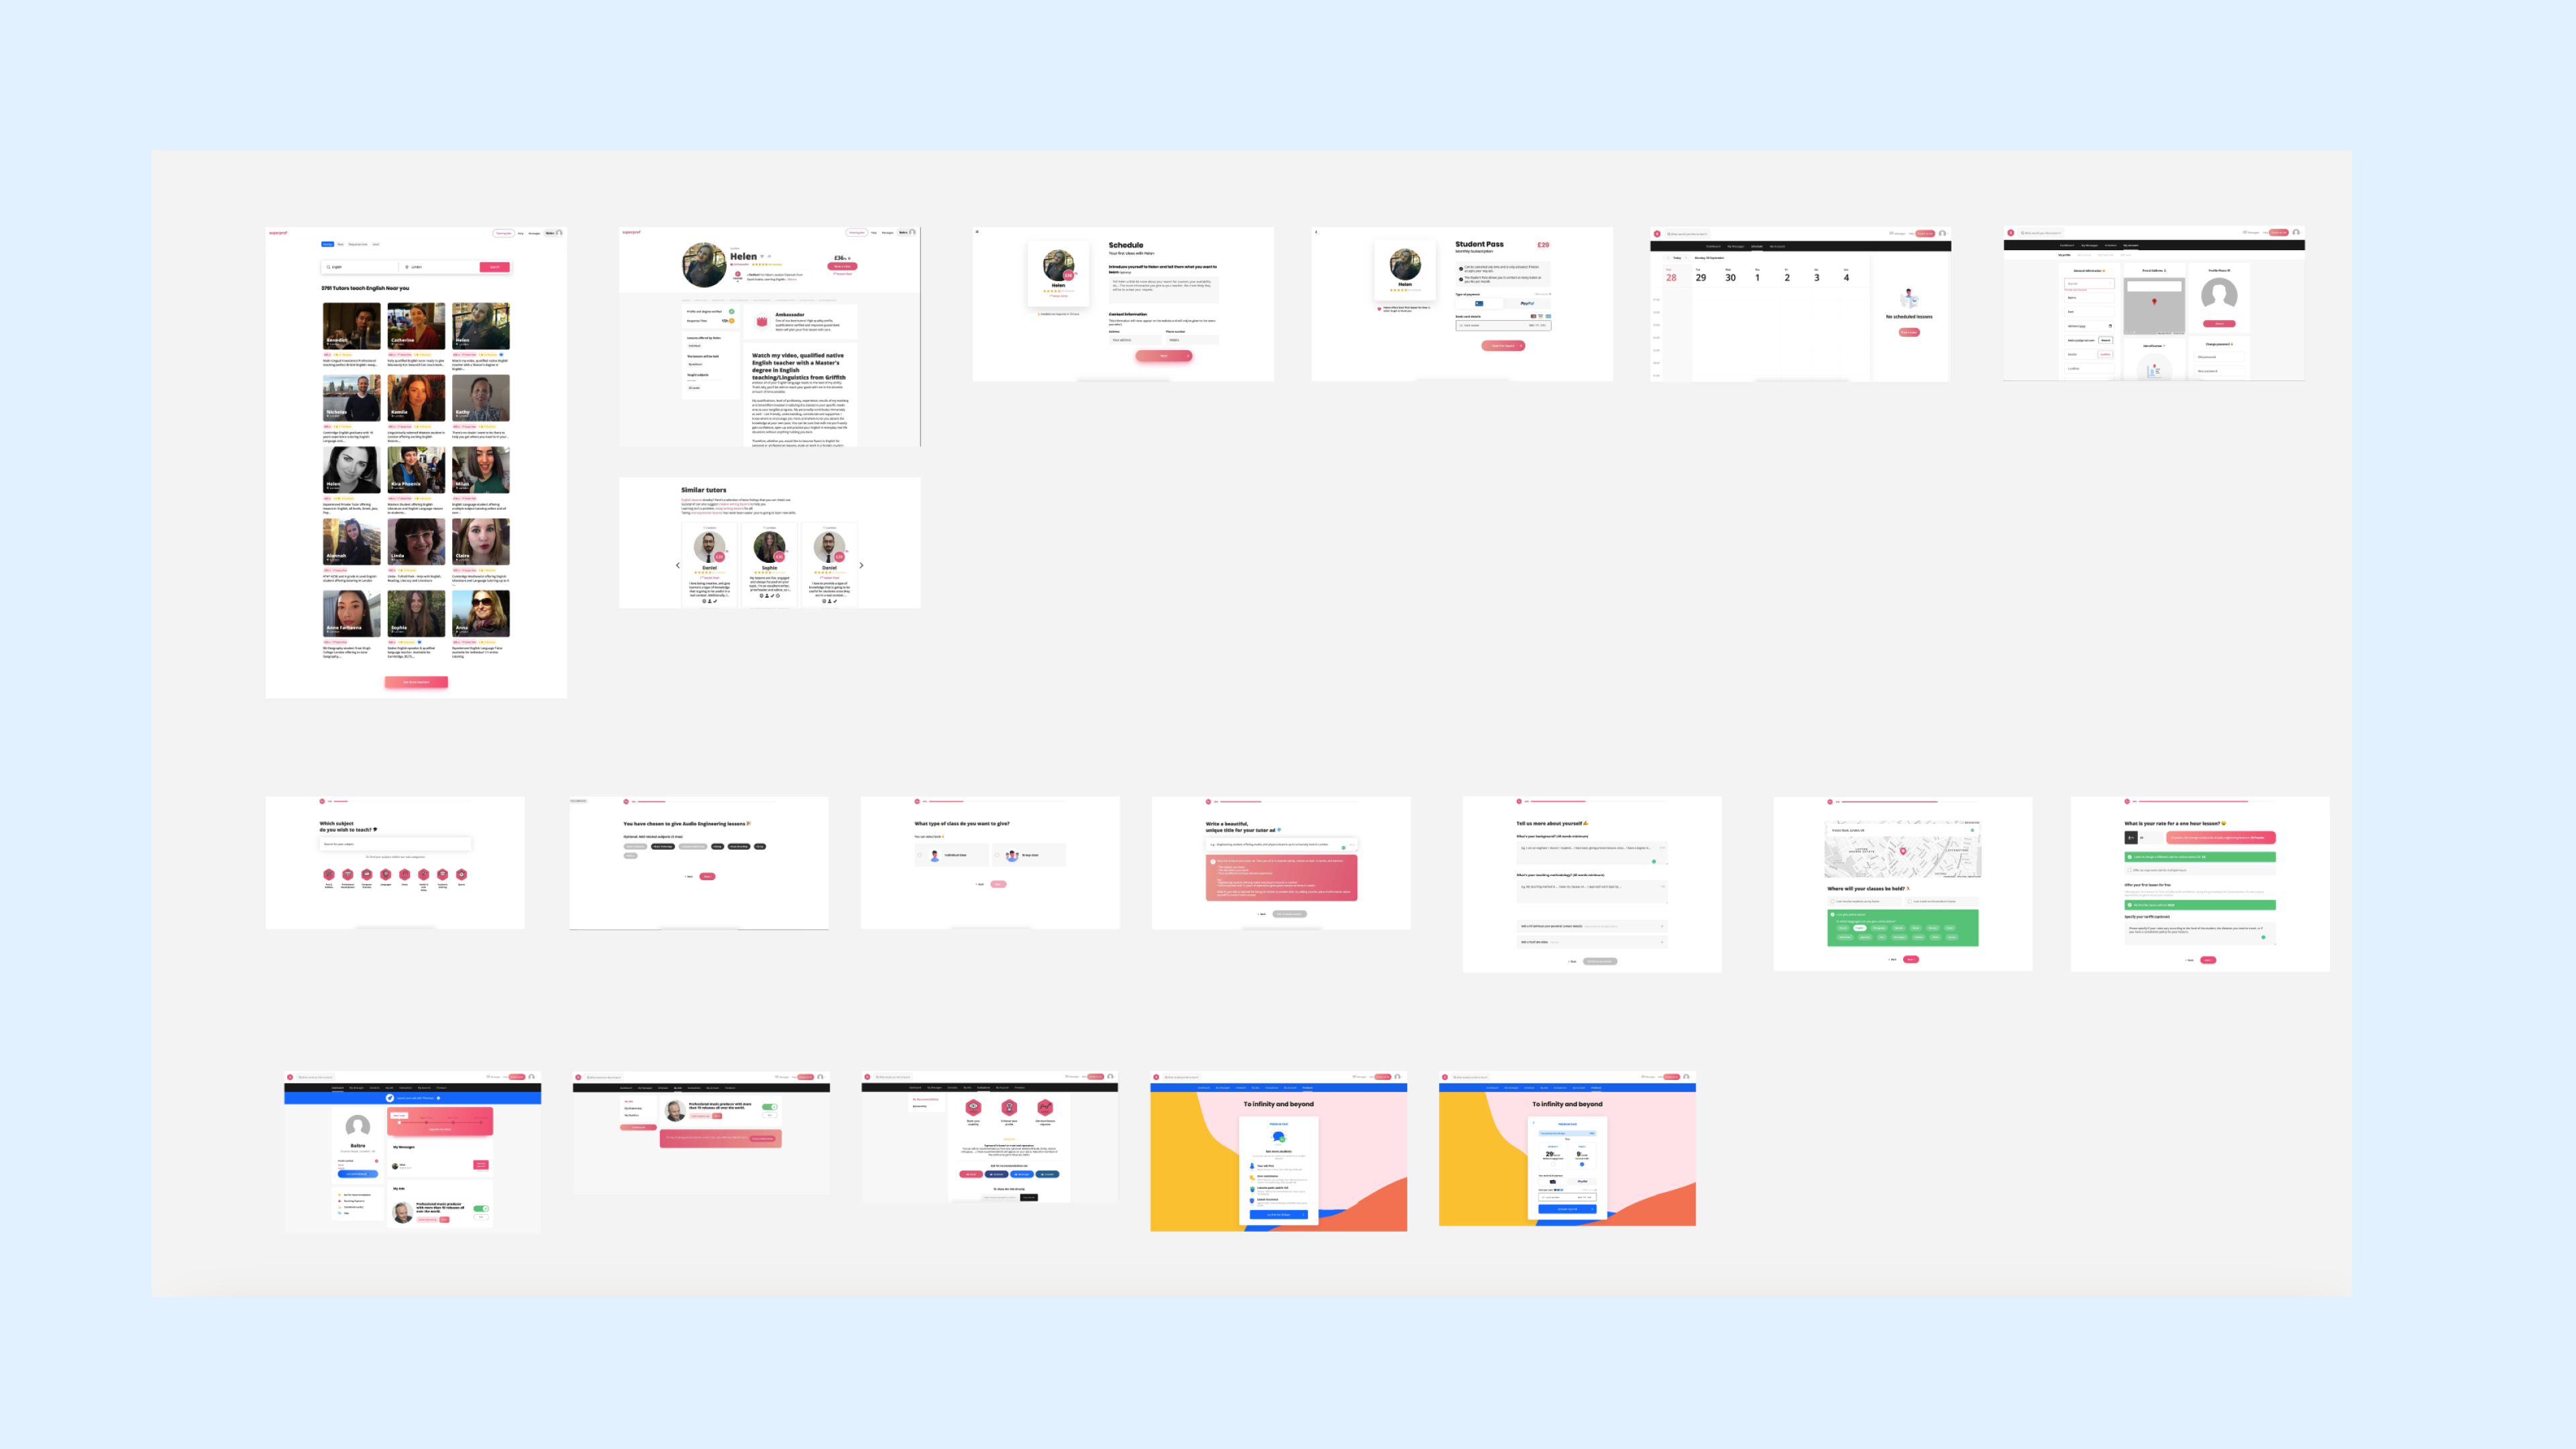
I considered everything I learned and identified so far and created multiple flows for our main scenarios. I also noted some possible edge cases to address in the upcoming iterations.

With a focus on user insights and feedback, I've designed a comprehensive dashboard and analytics system that offers actionable insights and intuitive navigation. Through careful analysis and user-centered design principles, the dashboard provides users with meaningful data visualization and performance metrics.


